
Story Maps is a multi-functional tool for digital projects that are map-driven and place-based, with a variety of templates that allow you to connect images, sound, video, and text to the map in different visual and sequential formats. This means you can learn one tool, but choose different layouts that might be more appropriate for different projects. Story Maps is also integrated with the powerful ArcGIS mapping platform. If your institution has an ArcGIS account (perhaps through your digital technologist, environmental sciences, or geography program), inquire about joining forces with the registered users— you might find an unexpected partner to bring a long-term or data-based aspect to your oral history project or community-engaged learning initiative.
Most of us doing community-based learning with oral history will start with the Story Maps app, which just requires an email to create an account. OHLA recommends starting with one of these templates, but there’s more to choose from!
- Story Maps Tour— a simple template driven by the map, images, and small amounts of text as captions.
- Story Maps Shortlist— consider this template if your media (sound, images, etc.) can be conceived of in different categories that you would like to map separately (i.e. by era or by type of community asset). Shortlist provides a tabbed layout and photos can be viewed with longer form text.
- Story Maps Journal— choose Journal if your focus os really on long form content with multiple media embeds (Youtube videos, Twitter embeds, Soundcloud audio etc.). This template works in sections, as a user scrolls through written content in one pane, large scale images appear in the other. This template works well without a map.
- Story Maps Swipe— choose this digital storytelling template for oral history projects that document community change or the impact of natural disasters, where overlaying two maps (historic or contemporary GIS) tagged with text, sound and imagery might best tell your story.
- Story Maps Crowdsource (New/Beta!) — The newest Story Map app allows for the public to contribute photos and text to your digital story map. You’ll need a full ArcGIS account to use it, and you’ll need to have someone assigned to consistently moderate contributions to be sure the contributions meet your project standards. Choose this map if your oral history project has a contemporary focus that is charting a social movement or how people use and value public and community places.
Why Choose This Tool?
Getting Started
Story Maps is a tool that is wildly customizable, user friendly, and effective. Once you get to the “Apps” portion of the site (which is fairly hard to find, click here for a quick link) you’ll see there is a plethora of options as far as layouts for your Story Map. This includes layouts such as the ability to compare two maps or two separate layers of a map (maybe a topographic and then a heat map or something like that), presenting any amount of separate maps with different layouts for that, creating a map that takes the user on a multimedia journey, presenting media associated with each section of the place, such as a map, 3D scene, image, video, etc., or the first option on the page which is just called “Story Map Tour” in which you present photos or videos with titles and captions and create them as points on an interactive map.
Backing up, though, the first thing you need to do is create an account with ArcGIS. This is super easy, as you can create an account with a Google or Facebook account. Once you create an account, click this link that will send you to a list of templates you can use.
Layout
As with our other tutorials and tool introductions, we’ll go through the front pages of the program piece by piece. The different templates for Story Maps have some different features and therefor look a little different, but here we will cover the Story Map Tour template. Each template will have some different fields to fill in or link to but, in general, this will cover what you need to know.
Images/Videos/Media
Right off the bat when you select the Story Map Tour template, Story Maps asks where you’re getting your media from. You’ll be asked to link to publicly viewable accounts on whatever media platform you choose. Don’t worry about having to stick to just one media site, Story Maps lets you select any of these options every time you import media.
After you select the media server and link to a public facing account, you’ll be asked to pinpoint this media on a map. You can change the point at any time as well as change the look of the map later, so don’t worry too much about getting this exact right off the bat.
Title/caption
In the top left corner of the screen you will see a Title box as well as a Caption box. Don’t be confused, this is only for the Story Maps itself, not for the individual image.
Save/Share/Settings/Help
Moving right along, the next buttons on the top center of the page are “Save”, “Share”, “Settings” and “Help” buttons. I feel the “Save” button is pretty self explanatory. The “Share” button lets you create a publicly shareable link to your Story Map, but you should obviously wait until it’s down to do this. The “Settings” button lets you change the layout of your Story Map, the colors of your text boxes, the header of your Story Map, the data associated with your images, and the zoom level of your map. This can be really convenient if you’re doing, say, a photography tour of London, and so you really only need the map to go to the city limits of London. The “Help” button pulls up a small introduction to the program with tips and tricks which is nice if you get stuck.
Basemap
Moving along, the “Change Basemap” button allows you to change the view or style of your map, with options such as a birds-eye view image to a topographic land map or even a topographic ocean map if your story happens at sea.
Left Panel
The left panel of Story Maps is dedicated to your media of choice. The buttons that read “Change Media” and “Change Thumbnail” allow you to reselect which media hosting site you select your media from as well as choose a new thumbnail if you choose to use a video or other media besides pictures. There are also two text boxes at the bottom of the image for the name and description of the image.
Add/Organize/Import
The “Add”, “Organize” and “Import”appear at the lower center of the page. “Add” let’s you paste the URL of media or choose a point on the map to go to without using a new image. “Organize” just let’s you rearrange your media in a different order than it already is. “Import”, once clicked, brings you to a screen that looks much like the starting screen, in which it asks you to select a media hosting site, type in a username, and select media. Then, once again, you will select a point on the map to choose where your media will be shown.
Embedding & Sharing
You can share your project on Facebook or Twitter just by selecting the social media icons at the top right of the screen. Or click the share button and copy the HTML, which you can paste into the text box of your WordPress site. Check out this tutorial for more on embedding and sharing.
The StoryMaps Tutorial
Storymaps offers an extensive tutorial, check it out!: https://storymaps.arcgis.com/en/app-list/map-tour/tutorial/
Project Examples
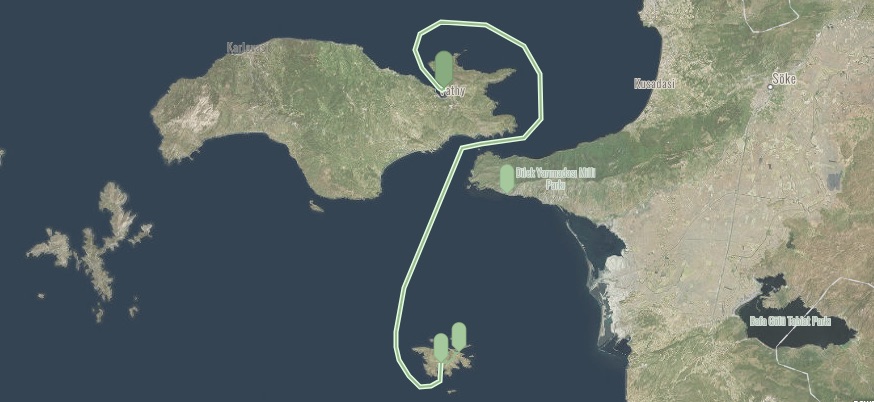
‘NOWHERE SAFE FOR CIVILIANS’: AIRSTRIKES AND GROUND ATTACKS IN YEMEN
https://aiusa.maps.arcgis.com/apps/MapTour/index.html?appid=2f697f1ee0764fe2bf8a07a1a58b0f0c
15 Years On Station: a Story Maps of the Internation Space Station
http://www.arcgis.com/apps/MapTour/index.html?appid=2e5900ccee6046be862990c947aa528c